
A quote promises a nine-year solar payback. Its multiplication looks correct: 8,000 kWh of generation times a 25-cent electricity price equals $2,000 a year, and $18,000 divided by $2,000 equals nine. The missing question is whether every generated kWh is actually worth 25 cents to this household.
This walkthrough audits that one claim, line by line. Every dollar, production figure and percentage in the example is a hypothetical input chosen for the exercise. It is not an installer quote, a measured installation, or a current utility tariff. Use the solar payback calculator to substitute your own figures.

Start with a small input sheet
Keep the proposal’s equipment and production estimates separate from its financial assumptions. For this exercise, the cash system price is $18,000, annual production is 8,000 kWh, direct household use is 40% of production, the avoided import price is $0.25/kWh, and usable export credits are $0.05/kWh. We assume no incentive and reserve $100 a year for maintenance.
These seven values are enough to audit the first year’s operating benefit. They are not enough to establish investment return or reproduce a real time-of-use electricity bill. Ask for the source of each input rather than accepting a final savings total on its own.
For tariff context, the California Public Utilities Commission explains that its covered net-billing customers use onsite solar first, while exports receive separate compensation that is usually below retail rates. That rule applies to the utilities and tariffs described there. Your account may have different terms.
Rebuild the first-year benefit
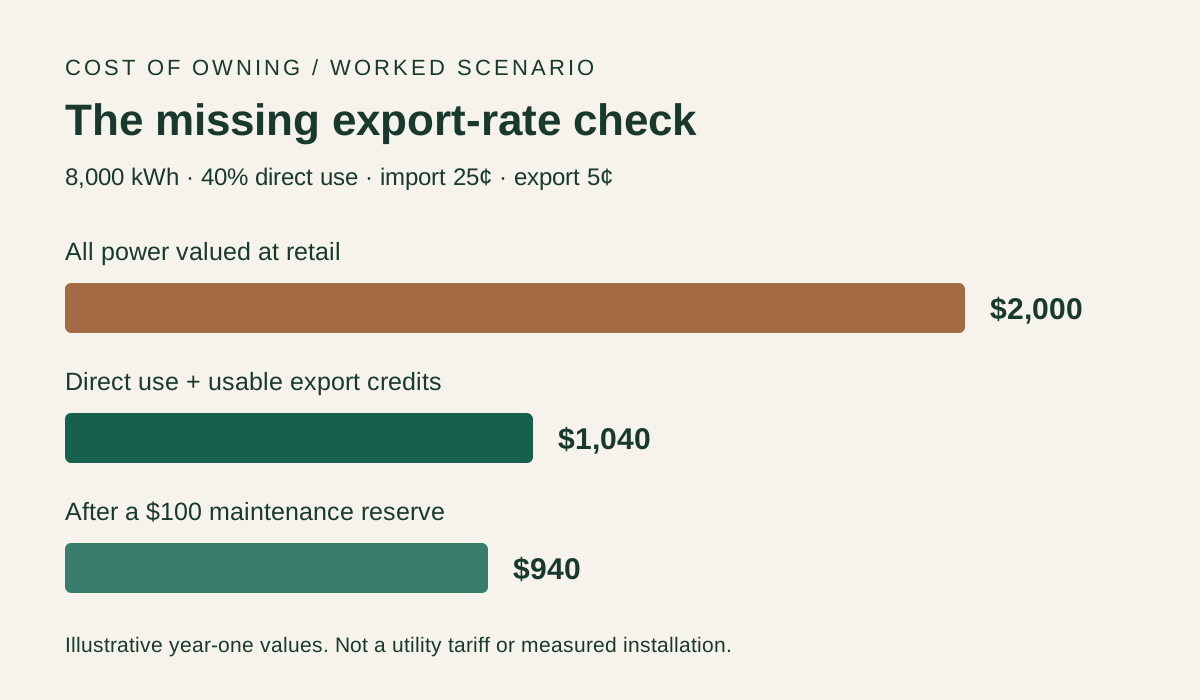
Direct use is 8,000 × 40% = 3,200 kWh. Avoided purchases are therefore 3,200 × $0.25 = $800. The remaining 4,800 kWh goes to the grid. At five cents, usable export credits are $240.
Energy value is $800 + $240 = $1,040. After the $100 maintenance reserve, first-year net benefit is $940. A year-one simple-payback calculation gives $18,000 ÷ $940 = 19.1 years.
The retail-only calculation overstated energy value by $960 per year: 4,800 exported kWh × the 20-cent gap between import and export prices. Adding maintenance accounts for another $100 difference. These are separate corrections; do not blame the whole change on one of them.
Even the corrected 19.1 years is a simplified ratio. It assumes first-year benefit repeats forever. It has no interest, output decline, major repair, tariff change or time value of money. It is a useful checkpoint rather than a forecast of the exact break-even date.
Find the assumption that changes the answer
Keep every input fixed except the direct-use share. At 20% direct use, first-year energy value is $720 and net benefit after the reserve is $620. Simple payback is 29.0 years. At 60%, net benefit becomes $1,260 and payback 14.3 years. At 80%, net benefit is $1,580 and payback 11.4 years.
Those percentages are sensitivity cases, not estimates of a typical home’s behavior. Direct use must be supported by the household’s usage pattern. Annual demand alone cannot tell you whether the household consumes electricity while the panels produce it.
A proposal that changes direct use from 40% to 80% needs an explanation: a different daily load pattern, a planned daytime EV charge, or storage. A battery also introduces cost and losses. Do not apply battery-style self-consumption to a panel-only price.
Our net metering and net billing guide explains the tariff mechanics and the export value sacrificed when a battery charges. This audit focuses on verifying a proposal’s arithmetic.
Inspect the long-term cash flow
Ask for the annual schedule behind any 25-year savings number. It should show the upfront outlay, yearly production, avoided imports, export credits, maintenance, replacement assumptions and financing costs, if any. A large positive number at year 25 can hide many years of negative cash flow.
Our calculator reduces annual output by an assumed 0.5%, holds exports and maintenance flat, and includes an editable $2,000 inverter reserve in year 12. Those are modeling choices, not promises of equipment life. It starts import-price growth at zero so the base case does not depend on rising prices.
Try the installer’s growth assumption and zero growth. If the purchase becomes attractive only at an aggressive annual increase, that assumption deserves the same scrutiny as the installed price. Export compensation need not increase with import prices, so growing both at one rate can quietly inflate the projection.
The model does not discount future dollars. A $1,000 benefit two decades away does not have the same economic value as $1,000 available today. Compare financing and alternative uses of cash separately before treating a nominal total as an investment recommendation.
Check what the proposal calls savings
A fixed monthly utility connection charge that remains after installation is not avoided spending. Neither is a minimum bill that the tariff still requires. Use the variable charges that solar actually displaces.
Check how export credits settle. Some credits expire, have restricted uses or receive a different year-end value. Enter the value you can use rather than a headline rate that may not apply to all production. Time-of-use schedules need interval data to distinguish midday generation from evening demand.
Also separate cash and financed prices. Interest and fees belong in the financed comparison. A tax benefit belongs in the model only if it applies to this project and household. The IRS states that the Residential Clean Energy Credit is unavailable for property placed in service after December 31, 2025. State and utility programs require their own eligibility checks.
Take five questions back to the installer
- Which tariff and settlement rules were used, and where can I read them?
- What share of generation is used directly, and what interval data supports it?
- Which charges remain on the utility bill?
- What happens with zero import-price growth and lower production?
- Does the annual schedule include repairs, loan fees, interest and the actual cash price?
Save the answers with the dated proposal. If two proposals use different assumptions, rerun them with one common set before comparing their payback claims. Our installation cost guide helps you check the equipment side; the methodology explains the limits of planning estimates.
FAQ
Does a long simple payback prove the quote is bad?
No. It shows that the modeled bill savings are slow relative to the cash cost. Backup, environmental preferences and other benefits may matter to you, but give them their own value rather than relabeling them as electricity savings.
Can I use my average bill divided by kWh as the import price?
Only as a rough starting point. That average can include fixed charges, taxes and other amounts that solar does not avoid. Identify the marginal charges and the hours of consumption for a more accurate comparison.
Is this an assessment of my home’s solar potential?
No. It is an arithmetic audit using hypothetical inputs. A site-specific production assessment and the applicable utility tariff are still needed. Sources were checked October 21, 2026.