
The 30% federal credit for homeowners is gone. The IRS says the Residential Clean Energy Credit, Section 25D, is not available for property placed in service after December 31, 2025, and the energy efficient home improvement credit (25C) ended the same way. For a 2027 project, every dollar has to come from production, price, and state or utility programs. On our assumptions below, a $30,000 system that would have paid back in 6.6 years with the credit now takes about 9.4 years, and a 4% electricity escalation shortens that to roughly 8.2 years.
What Actually Ended
The One Big Beautiful Bill Act, Public Law 119-21, was signed on July 4, 2025. Its energy provisions are summarized by SEIA and by law firm RSM. Two things changed for solar.
The residential side ended with no phase-out. The IRS 25D page states the credit covers property installed from 2022 through December 31, 2025 and is not available after that. The IRS FAQ on the law is precise about timing: under Section 25D, an expenditure is treated as made when the original installation is completed, so a system completed after December 31, 2025 cannot claim the credit even if you paid for it in 2025. The 25C page shows that credit ended for property placed in service after the same date.
The commercial side survives longer. Under Section 48E, solar must generally be placed in service by December 31, 2027, or have begun construction within 12 months of enactment, meaning by July 4, 2026, per RSM and SEIA. Energy storage is not subject to that placed-in-service deadline, and new restrictions apply to equipment from foreign entities of concern. A homeowner buying outright gets nothing from 48E. In a lease or power purchase agreement, the company that owns the system may claim the credit and can reflect some of it in your payment, which is a contract term to check, not a guarantee.
This is not tax advice. If a business, farm, trust, or third party is involved, confirm eligibility with a tax professional before signing anything.
What Still Reduces the Cost
- State programs. NYSERDA’s NY-Sun pays incentives through participating contractors, with an additional Affordable Solar rate for income-eligible households. Illinois Shines pays REC-based incentives to approved vendors who may pass savings to customers. The DSIRE database lists programs by state and utility.
- Utility rebates. These vary and expire. EnergySage’s California incentive page tracks examples, such as SMUD’s battery enrollment incentive of $300 per kWh up to $6,000. Verify current status directly.
- Net metering or net billing. Older net metering credits exports near the retail rate; newer net billing tariffs often pay less than retail, which erodes payback. The differences are covered in our net metering vs net billing guide.
- SRECs where they exist. Illinois and a handful of other states have active markets; most do not.
- USDA REAP, but not for typical homeowners. It serves agricultural producers and rural small businesses. Grants are paused while USDA rewrites the rules, with a proposed rule published October 1, 2026; guaranteed loans remain available.
- Installer pricing. Compare at least three quotes and ask for the cash price in writing. Our installation cost guide has current ranges.
Payback Math Without the Credit
This is our calculation. We assume $2.50 per watt installed, production of 1,452 kWh per kW per year (EnergySage’s national 8 kW figure of 11,614 kWh), and a July 2026 US average residential rate of 18.31 cents per kWh from the EIA Electric Power Monthly. That assumes every kilowatt-hour offsets a retail-priced kilowatt-hour; exports paid below retail would lower these savings. We ignore degradation, maintenance, and inverter replacement.
| System | Installed cost | Year-1 production | Year-1 value | Payback with 30% credit | Payback without |
|---|---|---|---|---|---|
| 8 kW | $20,000 | 11,614 kWh | $2,127 | 6.6 years | 9.4 years |
| 12 kW | $30,000 | 17,421 kWh | $3,190 | 6.6 years | 9.4 years |
| 16 kW | $40,000 | 23,228 kWh | $4,253 | 6.6 years | 9.4 years |
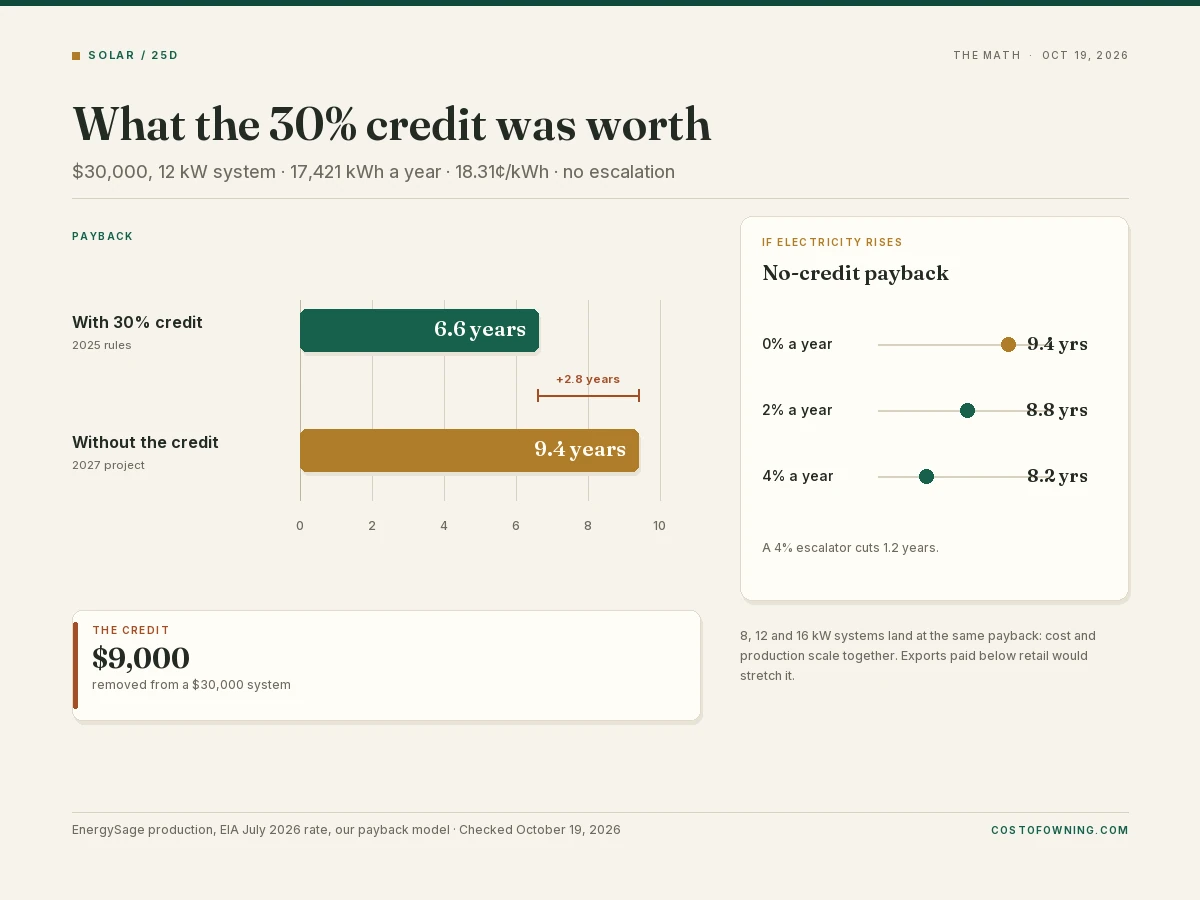
Payback percentages are identical across sizes because cost and production scale together; the real differences come from your rate, your production, and financing. Escalation helps early. With electricity rising 2% a year, the no-credit payback falls to about 8.8 years; at 4%, about 8.2 years. Over 25 years at 2% escalation, the 8 kW system produces about $68,100 of electricity value and the 16 kW about $136,200.
| Escalation | No-credit payback, 8 kW | No-credit payback, 16 kW | 25-year value, 8 kW |
|---|---|---|---|
| 0% (flat) | 9.4 years | 9.4 years | $53,200 |
| 2% per year | 8.8 years | 8.8 years | $68,100 |
| 4% per year | 8.2 years | 8.2 years | $88,600 |
There is no single national payback. Our payback guide shows state figures ranging from about 5 to 17 years, and the payback calculator lets you use your own rate and production.
How Financing Changes the Answer
Cash wins on total cost, but solar loans are common. SolarReviews reports typical 2026 loan APRs of about 5% to 10%, while Amerisave notes that many low-rate offers hide dealer fees of 15% to 30% inside the amount you finance. A 25% dealer fee on a $24,000 system means borrowing about $30,000 for the same hardware. Compare the full amount financed over the same term, not the advertised rate. Home equity loans and HELOCs often price similarly to solar loans without a dealer fee, but they put your house on the line.
Leases and PPAs trade ownership for no money down. Their escalators usually run 1% to 3% a year, and the provider keeps the credits and most of the long-run value. Compare the payment and energy assumptions separately with our solar quote audit.
Batteries: Backup, Not Arbitrage
Batteries are expensive. EnergySage puts the average installed cost at $1,128 per kWh as of October 2026 (checked October 19, 2026), about $11,300 for 10 kWh and $15,228 for 13.5 kWh. Bill savings alone rarely justify that. A worked example: shift 300 kWh a month from a 32-cent peak window to a 12-cent off-peak window. The 20-cent spread is worth $60 a month, or $720 a year before round-trip losses; at 90% efficiency, about $648. Against an $11,300 battery that is roughly 17 years, longer than many owners keep a house. Buy a battery for outage protection and resilience, and treat any arbitrage as a discount on that decision.
Questions to Ask Before Signing
- Which net-metering or net-billing version applies to me, and what is the true-up date?
- What exactly does the utility pay for exported power, and has that rate changed in the past two years?
- Does the contract promise a production guarantee, and how is a shortfall measured and paid?
- Who monitors the system, for how long, and what does monitoring cost after year one?
- Does the installation warranty preserve my roof warranty, and who repairs a leak, the roofer or the installer?
- Is the contract transferable to a buyer, and what credit check applies?
- What is the cash price, separate from any financed price?
FAQ
Is there still a federal solar tax credit in 2027?
For homeowners who buy a system outright, no. Section 25D ended for property placed in service after December 31, 2025. Commercial and some third-party-owned projects may still reach Section 48E through 2027 deadlines.
Can I claim the credit if I paid in 2025 but installation finished in 2026?
No. The IRS FAQ says an expenditure is treated as made when the original installation is completed, so a 2026 completion misses the deadline.
Does a solar lease get me the credit?
You do not claim it. The system owner may claim a commercial credit and may pass along value through pricing. Ask what happens to your payment if that credit is lost.
What shortens payback most now?
Using the power you produce, a high retail rate, state or utility incentives, and a lower installed price. Cash purchases with no dealer fee beat financed offers with inflated principal.